Transit investment is usually evaluated as a mobility project. But around stations, it can also behave like a long-term fiscal asset: shaping where housing is built, where commercial activity concentrates, how assessment bases grow, and how public revenue is eventually captured.
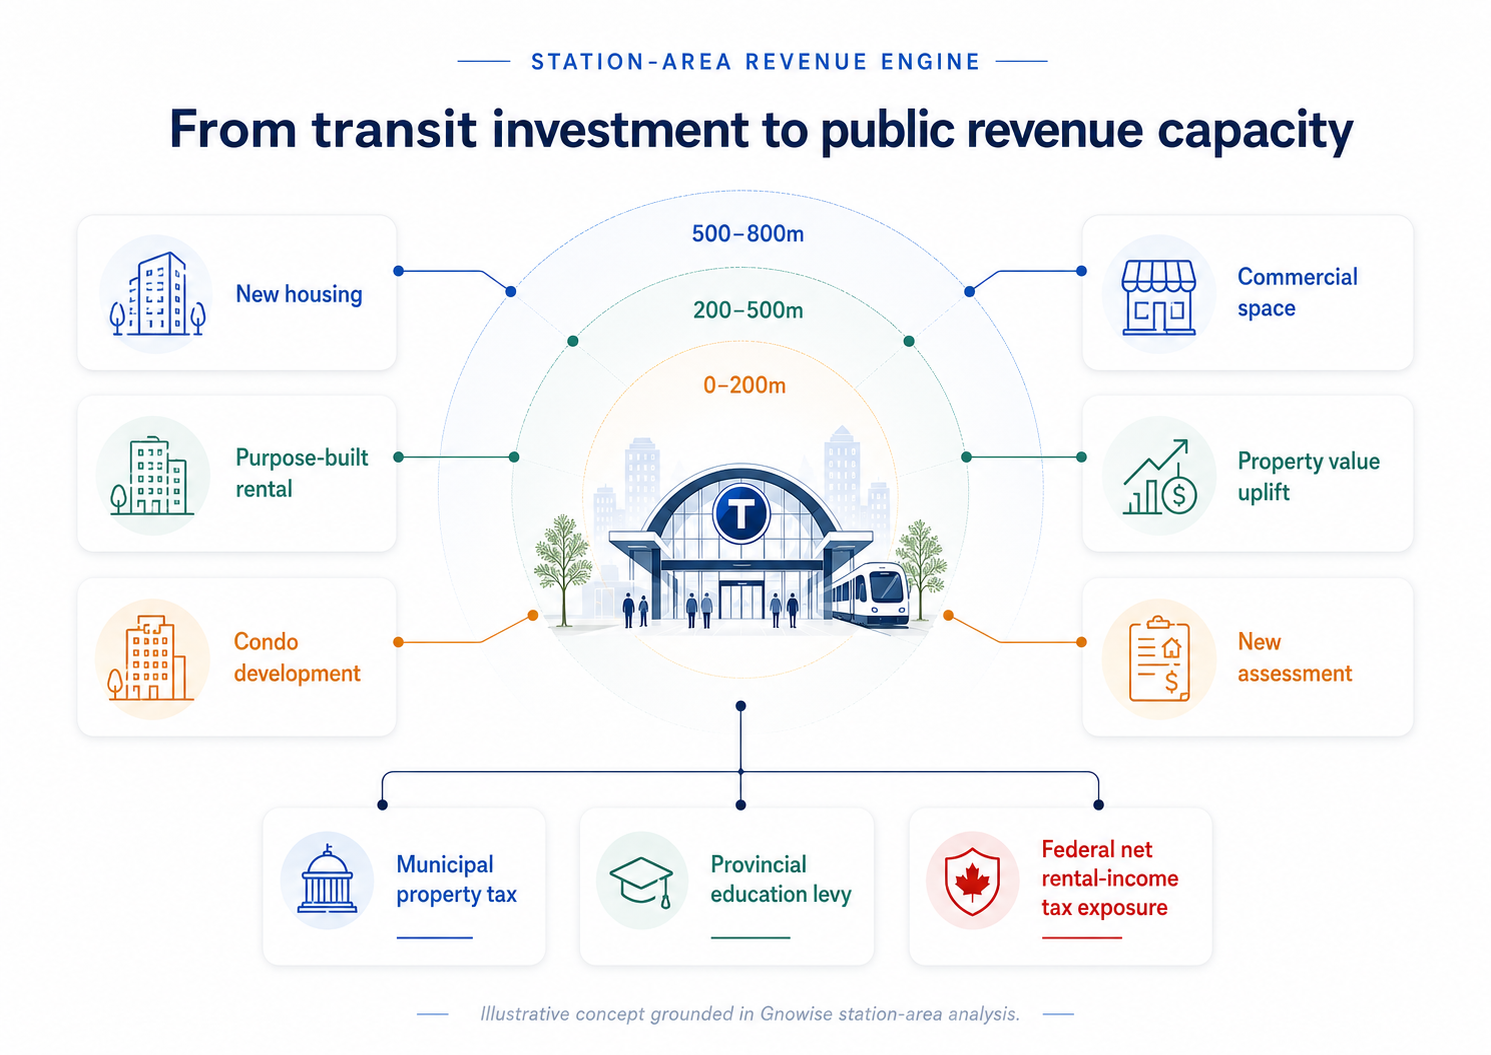
Figure 1. The station-area revenue engine. Transit-oriented development can create public value through multiple channels: housing supply, rental activity, commercial space, market-value uplift, new assessment, municipal property tax, provincial education levy, and federal net rental-income exposure.
How station-area growth can strengthen municipal tax bases, provincial education revenue, and federal rental-income exposure — if governments measure it correctly.
Governments often describe transit-oriented development through the language of housing supply, walkability, congestion relief, and climate resilience. Those benefits matter. But there is another argument that deserves far more attention: station-area development can become a long-term public revenue engine.
The core idea is straightforward. When governments invest in higher-order transit, improve zoning around stations, and enable more housing and commercial activity within walking distance, they can create measurable economic value. That value appears in several places: new development, higher land utilization, stronger property values, more rental activity, more business activity, and ultimately a larger public revenue base.
But the revenue story has to be presented carefully. A common mistake is to say: “property values rose near transit, therefore municipal tax revenue rose.” In Ontario, that is not automatically true. MPAC states that 2026 property assessments remain based on January 1, 2016 current values because reassessment has been postponed. It also explains that updates to assessed value still reference the January 1, 2016 value base.
That means a scientific station-area report should separate three different things:
- Current realized tax revenue based on the existing assessment roll.
- New assessment revenue from new construction, additions, classification changes, or major renovations.
- Assessment-equivalent scenarios showing what public revenue could look like if current market uplift were reflected in a future reassessment.
This is the core methodological point: market appreciation, assessed value, and realized tax revenue are connected, but they are not interchangeable.
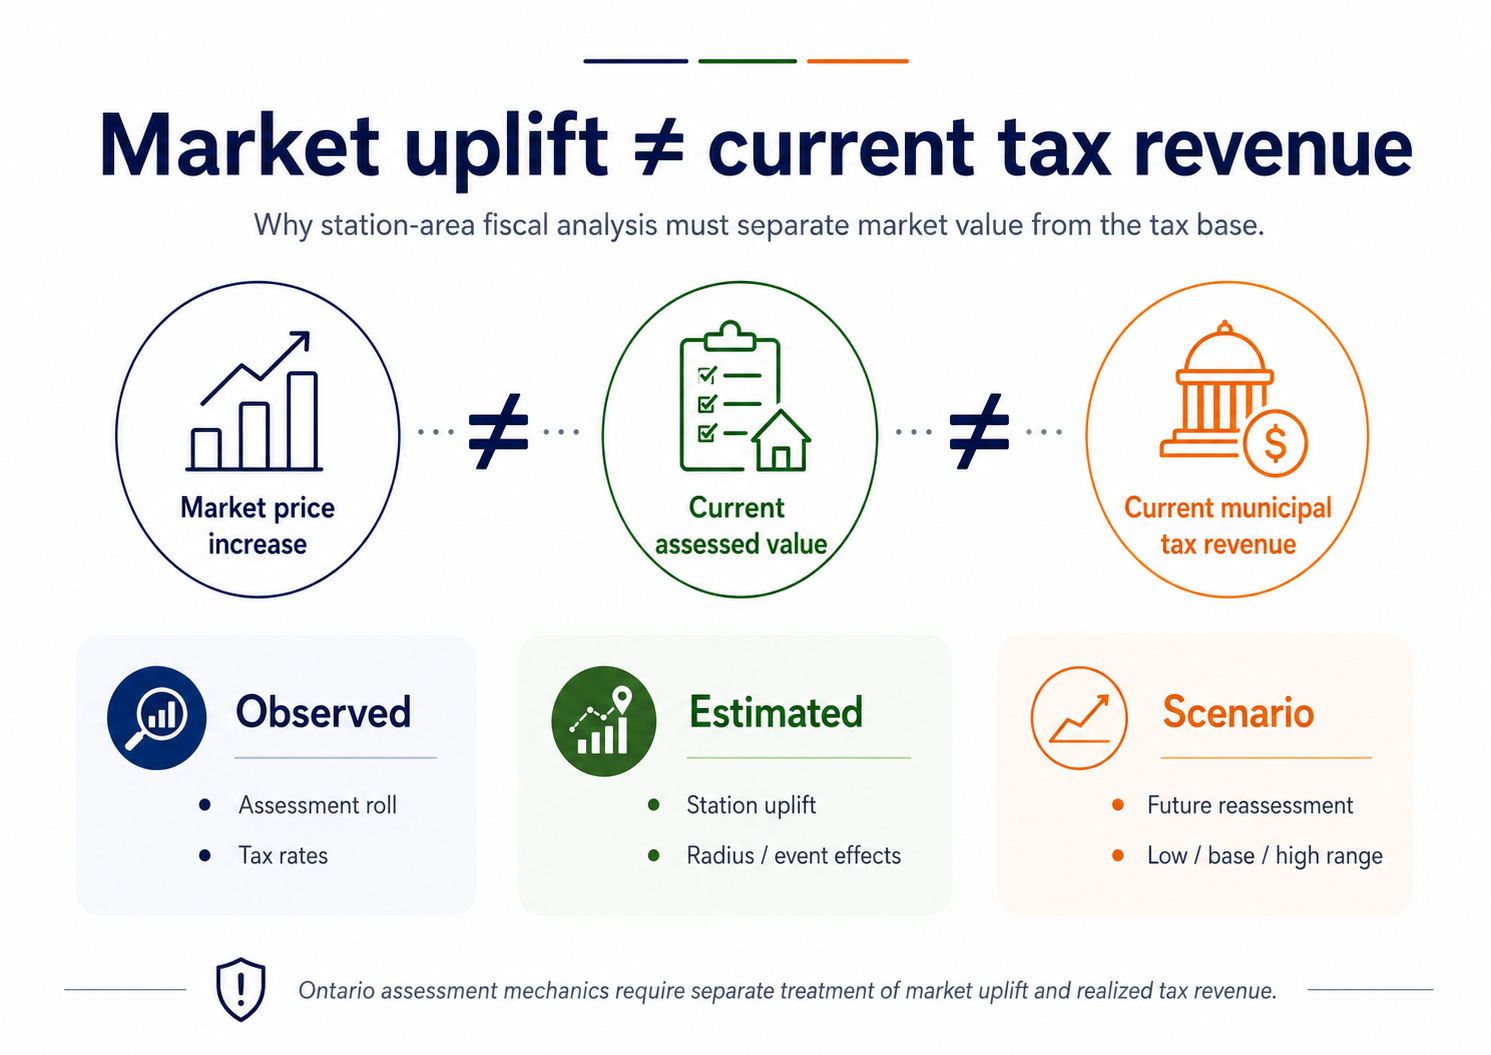
Figure 2. Market uplift is not current tax revenue. A credible station-area fiscal model should separate observed tax-base data, estimated station-area uplift, and scenario-based future reassessment impacts.
This distinction is where Gnowise can create a much more sophisticated public-sector narrative than a simple “transit increases values” story. The Gnowise framework already recommends separating observed, estimated, and scenario-based evidence, rather than blending everything into one headline number.
The municipal case: growth that can eventually pay back infrastructure
For municipalities, the direct fiscal lens is property tax. In Toronto, property tax is composed of the City tax rate, education tax rate, and City Building Fund component. The 2025 City of Toronto rates show these components separately by class, including residential, multi-residential, new multi-residential, commercial, industrial, and other classes.
That class-specific detail matters. A condo tower, a purpose-built rental building, a commercial building, and a mixed-use project will not produce the same fiscal profile. A credible station-area report should therefore model municipal revenue by:
- property class,
- tenure type,
- development stage,
- station ring,
- assessment status,
- and timing of completion.
The best fiscal argument is not that every dollar invested in transit is immediately recovered through higher property tax. The better argument is that station-area development creates a durable tax-base expansion channel, especially when new supply is delivered, assessed, and added to the roll.
The provincial case: education levy growth
The Province also has a direct fiscal interest. Toronto levies and collects the education tax portion on behalf of the Province. In the City’s 2025 education tax levy report, Toronto stated that the Province would receive an additional $32.358 million in education tax levies in 2025 from new development and assessment growth, largely driven by condominium, multi-residential, and commercial development.
This is highly relevant for station-area development. If new transit-oriented housing and mixed-use projects expand the assessment base, then the Province benefits through education levy growth. That means station-area planning is not only a municipal finance issue. It is also a provincial fiscal-capacity issue.
The policy implication is important: when provincial governments fund or enable transit-oriented growth, part of the fiscal return may come back through education levy expansion. But again, the report should avoid overstating the effect. The revenue comes from assessed value and new development, not from a simple gross resale-price increase.
The federal case: rental income, but not gross rent
The federal revenue story is more indirect but still important. If station-area development increases rental supply and rental revenue, that may increase taxable rental income. However, CRA does not tax gross rent directly. CRA’s rental guide explains that rental reporting involves gross rental income, deductible expenses, and net rental income or loss. It also states that deductible expenses are subtracted from gross income to calculate net rental income before adjustments.
So the correct federal model is:
gross rent → effective rent after vacancy → operating expenses → financing and deductions → taxable net rental income → federal tax exposure
That should be shown as a scenario range, not as a precise realized revenue number.
What Gnowise adds
The value of Gnowise is that it can make this analysis station-specific, radius-specific, and event-specific. The current station-area framework correctly avoids reducing everything to one 500m average and instead recommends concentric rings, event phases, fiscal labels, and confidence tiers.
From Gnowise data, the cleaned descriptive price sample shows that station-area effects are not uniform. Some stations outperform their municipal benchmark; others underperform. That is exactly why governments need station-level analysis instead of generic TOD assumptions.
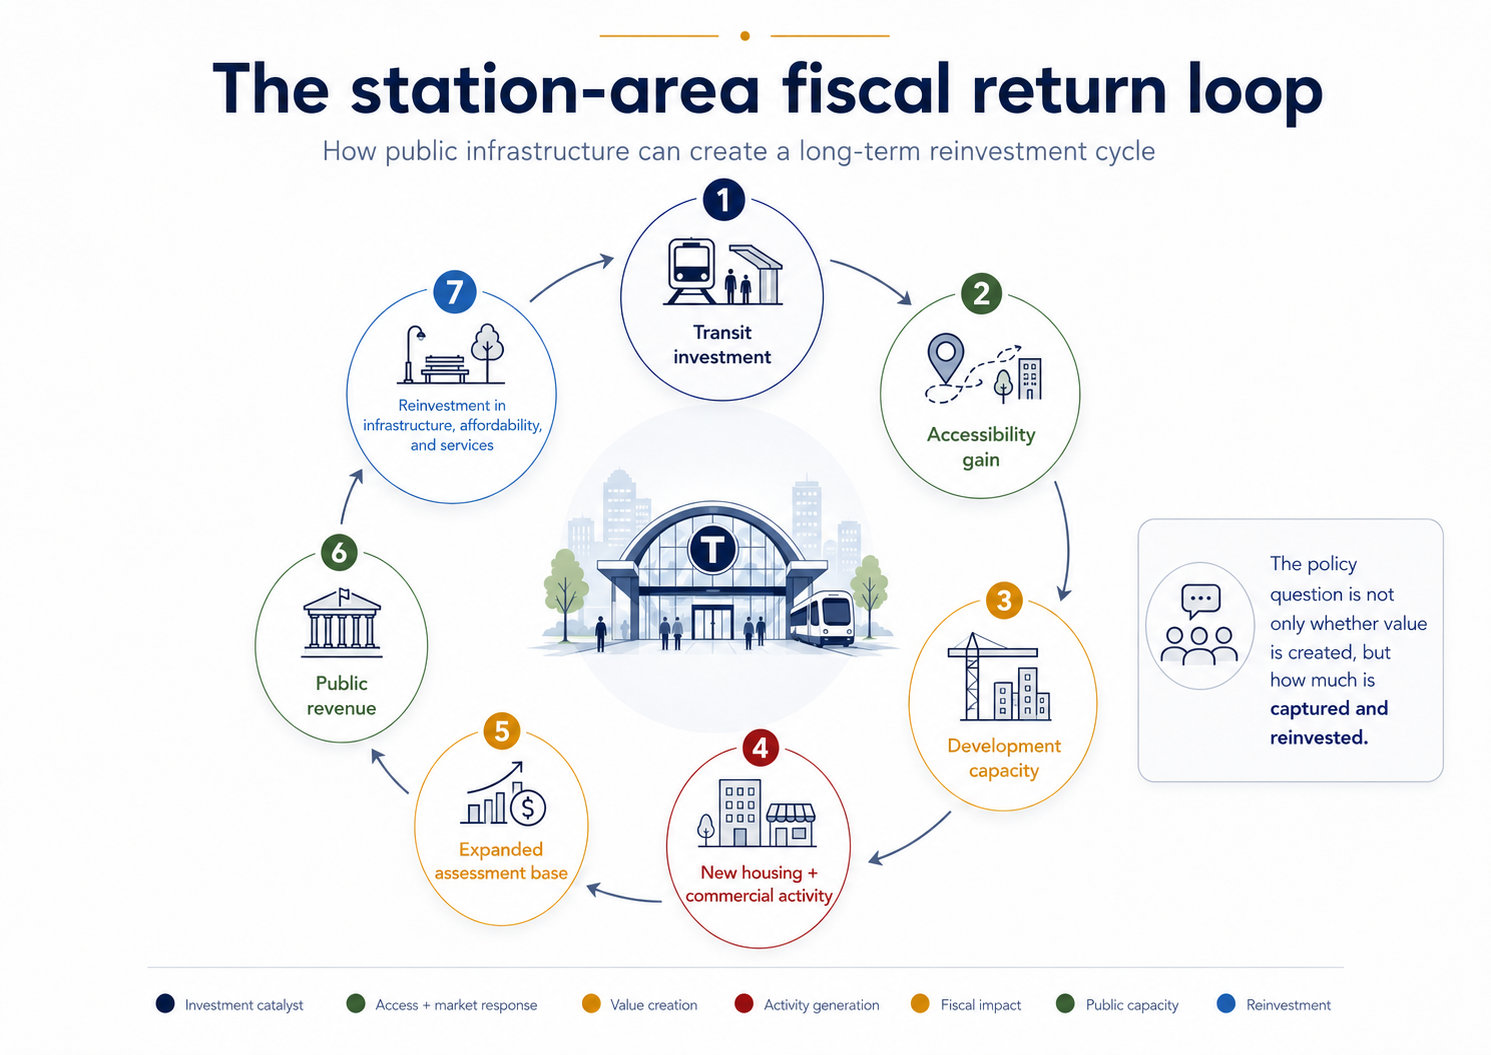
Why governments should invest more — and measure better
The fiscal argument for transit-oriented development is strongest when it is framed as a long-term reinvestment loop. Public infrastructure improves accessibility. Accessibility supports development capacity. Development can expand housing, commercial activity, and the assessment base. That, in turn, can strengthen public revenue capacity and create room for reinvestment in infrastructure, affordability, and services.